 New figures from the Regional Multiple Listing Service suggest our current hot real estate market recently transitioned from white to red. No, that’s not wine we’re talking about. Instead, we’ve gone from white hot to red hot, because home supply just increased from a shockingly low 1.2 months to a slightly less alarming 1.8 months.
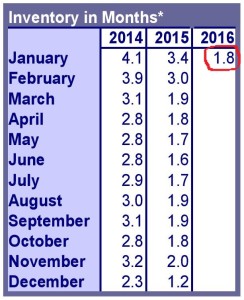
This housing backlog shift is more easily understood by looking at the above table. Historically, January inventory figures are largest and represent a ‘high point,’ followed by an overall reduction in housing supply later in the year.
Spoiler Alert
But if 1.8 months of Portland metro area home supply is our largest in 2016 and followed by the usual continued decrease, a case could be made for predicting some truly historic low numbers to come, possibly in the inventory range of below one month. That would present seriously new territory for our housing market.
Neighborhood On Fire
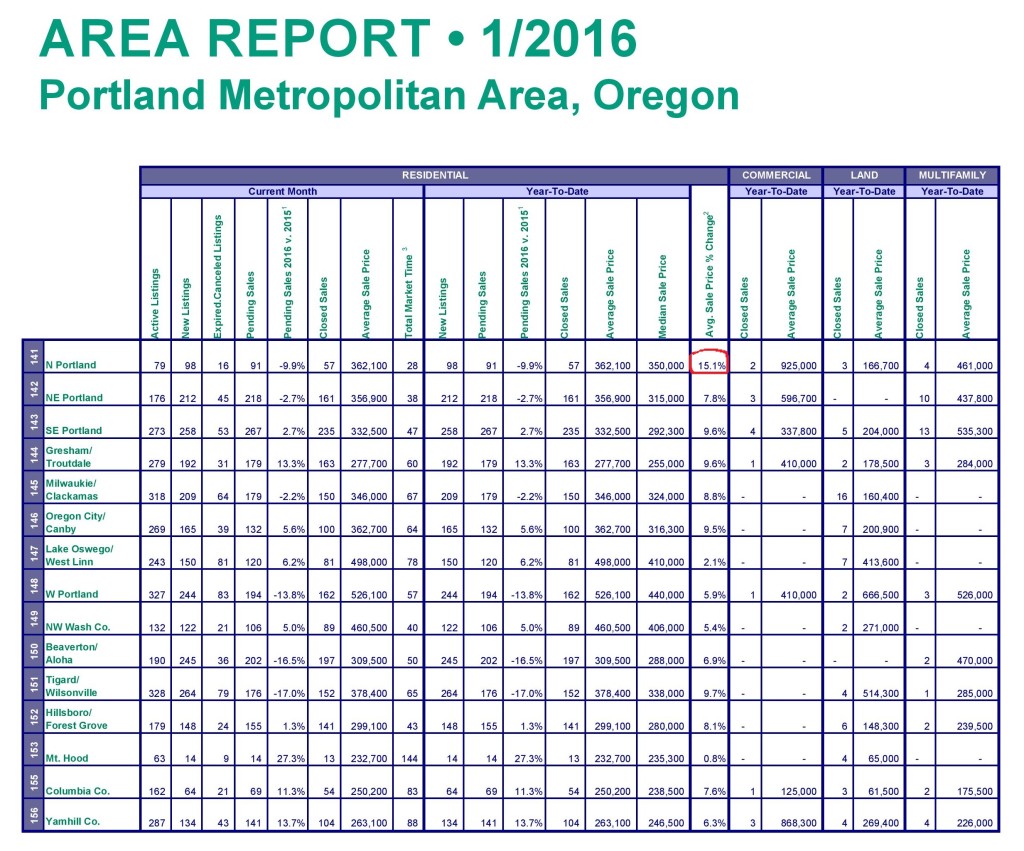
Annual price appreciation in a few Portland neighborhoods stands out. A case in point is North Portland, which sports a 15.1% annual appreciation rate in the above table, even with a solid average selling price of $362,100.
Up, Up & Away
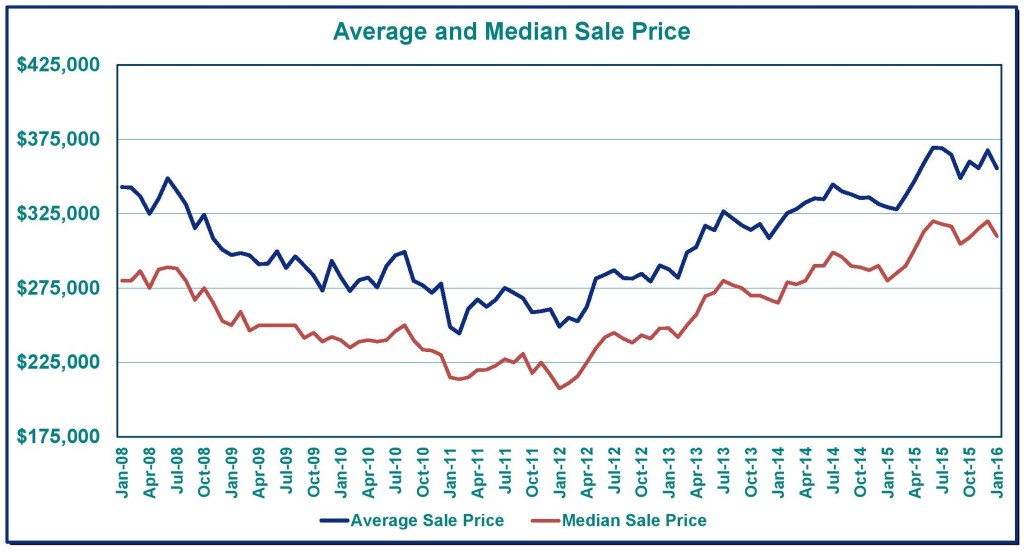
This continued low supply of homes has a direct effect on home prices: Up. As seen in the above chart, home values throughout the greater Portland metro area continue to climb.
View Your Area’s Market Statistics Here
Interesting new figures for key market statistics like average market time and selling price are available for towns and cities throughout the Portland metro area. View the latest Portland metro housing figures for your neighborhood or town by clicking here or the Market Action image above.
Is Now The Time?
This combination of seriously low inventory and attractive interest rates provides a rare ‘seller’s market’ opportunity for the sale of Oregon real estate. Contact the experts at Certified Realty for a free analysis of what your property could sell for in our current seller’s market by using the convenient contact form below.